|
Accessories |
|
This page
introduces several important and useful applications of the latent rank
theory (LRT)/ neural test theory (NTT). |
|
Can-Do Chart |
|
Drawing a can-do
chart (or “achievement progress table”) is the most important
task when standardizing tests using LRT, and it is no exaggeration to say that
LRT is just an essential tool for making the chart. The chart is
important for converting tests into qualifying tests for grading
achievements. |
|
In this example,
the test data is analyzed using five latent ranks. Using the item reference
profile (IRP), which expresses each item’s correct-answer ratio for
each latent rank, we can identify the sort of items that people in each
latent rank tend to pass and to fails. We create can-do statements to
describe the ability profile for each latent rank. Creating the statements is
almost impossible without the help of subject experts or teachers. |
|
The can-do chart
helps teachers and test administrators explain the degree of advancement by
each examinee or student, which leads to improvement in the accountability of
the test. Ensuring accountability is particlarly important for large-scale
public tests. Creating the chart clarifies the route to the final goal, i.e., subject
mastery. The larger the number of items on the test, the richer the
route map. In LRT, new items can be added to the
item pool (item bank) by test equating. The can-do chart should be
reviewed periodically and when new items are equated onto the item pool. |
|
In classical test
theory (CTT) and item response theory (IRT) , in which each examinee’s
ability is evaluated on a continuous scale, it is not easy to clarify the
relationship between ability specification and continuous score varying. In
LRT, in which each examinee’s ability is located on an ordinal scale,
it is easier to clarify the relationship between them. |
|
IRP
Indices |
|
IRP (item
reference profile) indices, which were proposed by Prof. Kumagai, are useful
for roughly grasping the shape of each IRP and generally understanding the
characteristic of each item without viewing the IRP plot. In addition, they
are useful for selecting the appropriate item to present next to an examinee in
computerized adaptive testing. |
|
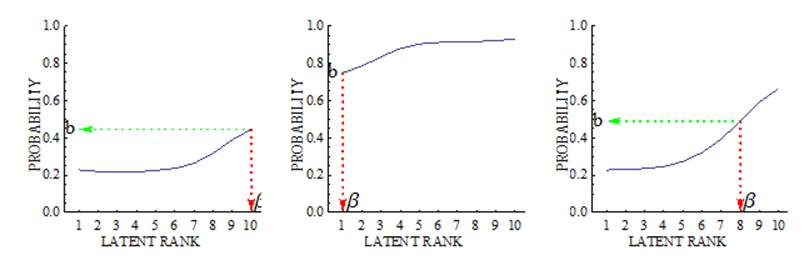
Item difficulty is an
IRP index for expressing the difficulty of each item. Beta is
the location of the latent rank when the IRP value is closest to 0.5, and b is
the value at beta.
|
|
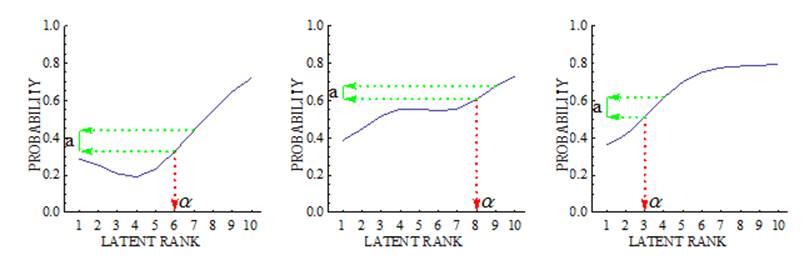
Item discriminancy is an
IRP index representing the power to measure the target ability. Alpha is
the smaller latent rank with the maximum difference in the IRP value among
all adjoining rank pairs, and a is
the size of the difference. The item with the larger a has
more power for discriminating whether an examinee belongs to the latent rank
larger or smaller than latent rank alpha.
|
|
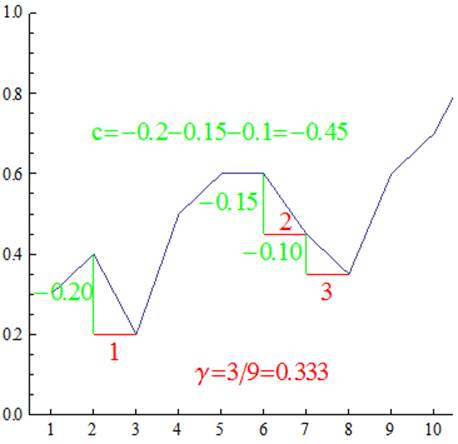
Item monotonicity
is an IRP index summarizing the heave degree of each IRP, it does not always
increase monotonically. The example IRP plot below declines in three
adjoining pairs out of nine, so gamma is calculated to be 0.333 (=3/9). Index c
is the amount of the reduction.
|