|
Features |
|
This page introduces the features of
the latent rank theory (LRT) / neural test theory (NTT) and the main output
obtained from LRT analysis. |
|
LRT/NTT is a test theory designed for evaluating
achievements in ordinal grades, and each grade is called a “latent
rank”. “Latent rank” is a statistical term, and can be
rephrased as “achievement stage”, “ability level”,
“progress step”, “advancement degree”, and so on,
corresponding to the application. A test taker with a higher rank
generally has a higher ability. |
|
The number of latent ranks is
determined by the test administrator or data analyst. Goodness-of-fit indices
are used in this determination. |
|
Item Reference Profile |
|
These
plots, called item reference profiles (IRPs), are
used for interpreting the behaviors of the correct answer rate. They
correspond to the item characteristic curves (ICCs) in item response theory
(IRT). In practice, IRPs can be constrained to increase monotonically (strongly ordinal alignment condition). |
|
Test
Reference Profile |
|
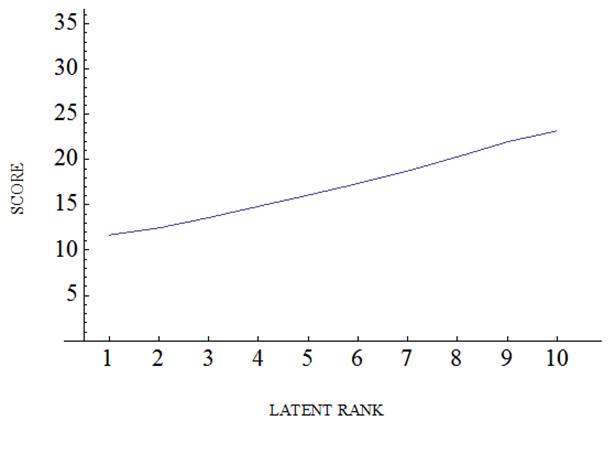
The
test
reference profile (TRP) is the sum of the IRPs. It expresses the
expected score for the examinees at each latent rank. In the example shown
here, the number of correct answers for the examinees at rank 6 (R6) is
slightly above 15. Although not every IRP monotonically increases, the
obtained TRP shape almost always increases monotonically increases. This is
evidence that the latent scale assumed in the LRT is ordinal. Although some
IRPs do not monotonically increase, the latent scale is ordinal (weakly
ordinal alignment condition) because the obtained TRP increases
monotonically. |
|
Rank Membership Profile |
|
These
plots, called rank membership profiles (RMPs), are useful for reviewing the
behavior of each examinee's membership probability for each latent rank. The
latent ranks can be estimated using the maximum likelihood method or the
Bayesian method. Either methods can be used to examine the goodness-of-fit of
the LRT model. |
|
Latent Rank Distribution |
|
The
left plot is the latent rank distribution (LRD), which is the
distribution of the estimated ranks of the examinees. The latent ranks of the
examinees outside the target ability of the test are estimated to be at the
ends of the latent rank scale. This characteristic is derived from the SOM.
For those test practitioners who want to grade examinees into ranks with
nearly equal frequencies, the Bayesian estimation method is useful. The right
figure is the posterior LRD when a weak prior distribution is given. |
|
Rank Membership Distribution |
|
The
left plot is the rank membership distribution (RMD), which is the
sum of the rank membership profiles. Its shape is usually smoother than that
of the latent rank distribution. The RMD can be said to show the features of
the population, while the LRD shows those of the sample. The right plot is
the posterior RMD when a weak trapezoidal distribution is given as the prior
distribution. |
|
Observation Ratio Profile |
|
The
dashed lines in the left and right plots are, respectively, the weighted and
unweighted observation ratio profiles (ORPs), which are used to monitor the
transition of the item response-missing ratio through the latent ranks. The
shape of the weighted ORP is smoother than that of the unweighted one. These
plots show that examinees with higher abilities responded to this item
(testlet) more often. (The examples shown here are for cases analyzed using
the graded LRT model for polytomous data.) |